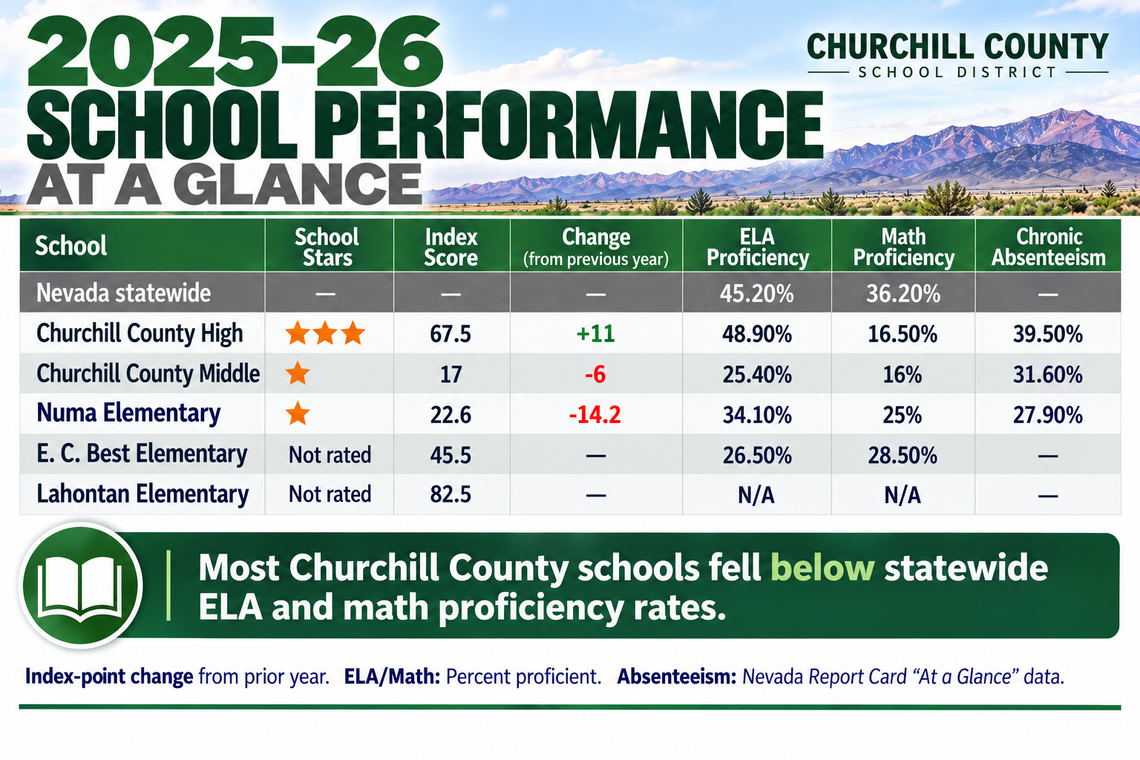
Churchill County High School gained 11 points in Nevada’s latest school accountability ratings, while Churchill County Middle School lost 6 points and Numa Elementary fell 14.2 points.
At the district level, Churchill County School District received Level 3, the highest of the state’s three rating levels, for district support and Level 1, the lowest rating level, for school outcomes. Churchill was the only Nevada district or charter school sponsor with that combination.
The Nevada Department of Education recently released its 2025-26 accountability results, including star ratings for individual schools and Nevada’s first performance ratings for school districts.
Churchill County High School received three stars with an index score of 67.5. Churchill County Middle School and Numa Elementary each received one star, with index scores of 17 and 22.6, respectively.
What Do the Stars Mean? — A school’s star rating is not the percentage of students who passed state tests. Nevada combines several measures into an index score that determines a school’s rating of one to five stars. Elementary and middle school students take the Smarter Balanced Assessment Consortium (SBAC) assessments, while high school juniors take the ACT, making direct comparisons between grade levels difficult.
Academic proficiency and student growth are important parts of elementary and middle school ratings. High school ratings also include graduation and college and career readiness.
Among Churchill County students in grades 3-8, 28.6% met state standards in English language arts and 21% in math. Statewide, those rates were 45.2% and 36.2%, respectively.
Results varied by school. Churchill County High reported 48.9% proficiency in English language arts, above the statewide rate, but 16.5% in math. Numa reported 34.1% in English language arts and 25% in math, while the middle school reported 25.4% and 16%, respectively.
Churchill County Schools — The high school showed the strongest upward movement among the rated schools, reaching an index of 67.5 and three stars. The middle school returned to its 2023-24 index of 17, while Numa recorded the largest decline and finished with an index of 22.6.
E. C. Best Elementary School and Lahontan Elementary School did not receive star ratings. State data show index scores of 45.5 for E. C. Best and 82.5 for Lahontan. The reason they were not assigned star ratings has not yet been confirmed.
What Do the Improvement Designations Mean? — Two schools also carry federal improvement designations. Churchill County Middle School is designated for Comprehensive Support and Improvement (CSI), which calls for broader schoolwide improvement. Numa is designated for Additional Targeted Support and Improvement, which identifies low performance among a particular student group.
Graduation, Proficiency, and Attendance — The district reported an 85.9% graduation rate for 2025-26. Graduation and state test proficiency measure different things. Students may meet graduation requirements without scoring proficient on a state assessment.
The Nevada Report Card lists Churchill County’s chronic absenteeism rate at 31.9%, meaning nearly one-third of students were chronically absent during the school year.
School reports show different absenteeism rates depending on the state measure used. The At a Glance figures list chronic absenteeism at 39.5% for Churchill County High, 31.6% for the middle school, and 27.9% for Numa. The Nevada School Performance Framework reports lower rates for those schools. Because the two measures are calculated differently, they should not be treated as the same figure.
District Support High, School Outcomes Low — Churchill County received an overall Level 2 rating, the middle of three levels under Nevada’s new District Performance Framework. But the two parts of that rating were very different. Churchill received Level 3, the highest rating, for district support and Level 1, the lowest, for school outcomes.
Churchill was the only district or charter school sponsor in Nevada with that combination.
District support looks at five areas: qualified teachers, fair distribution of staff, instructional materials, college and career readiness opportunities, and financial stability. School outcomes look at how schools within the district performed.
Of Nevada’s 17 county school districts and the State Public Charter School Authority, 12 received an overall Level 2 rating, three received Level 1, and three received Level 3. The first-year ratings establish a baseline and carry no formal penalties.
What Comes Next — The results show where Churchill County schools improved, where they lost ground, and how students performed against state standards. The numbers alone do not explain why.
Churchill County School District Superintendent Blake Cooper said the district welcomes the new performance framework.
“As the Nevada Department of Education releases its updated 2026 performance framework, we welcome these measurements as a valuable roadmap for our schools.
“Academic scores tell only part of our story. In Churchill County, we are deeply committed to educating the whole child. Whether it’s leading the state in athletic achievement, building inclusive classroom communities, or expanding hands-on career training, our staff works tirelessly to build a strong foundation for every student.
“We look forward to another productive year focused on student learning and high-quality instruction for the students of Churchill County School District.”










Comment
Comments